120+ DataproductOwner, 600+ Dataproducts
Let’s be honest: once you operate hundreds of data products, “good ownership” can’t depend on who tells the best story in a quarterly meeting. It has to show up in the signals your platform already produces every day.
That’s the idea behind this scorecard.

It’s not a beauty contest. It’s not a leaderboard. And it’s definitely not a bonus spreadsheet. It’s a lightweight, operationally grounded way to make ownership visible, fair, and scalable—using telemetry you already have: monitoring, CI/CD, ticketing, IAM/access flows, and catalog metadata.
The outcome you want is simple:
Data Product Owners feel rewarded for reliability, clean evolution, low consumer friction, and sensible costs—without having to manually prove their value.
The non-negotiables
Before we talk metrics, the rules:
- Normalize by usage. A popular product shouldn’t be punished for being popular.
- Use maturity levels, not rankings. Bronze / Silver / Gold beats “Top 10” at scale.
- Reward improvement, not only peaks. Trends matter, especially for products starting behind.
- Guard against gaming. Only count signals that reflect real impact (severity thresholds, traffic thresholds, consumer-impact only).
The scorecard (6 dimensions, 0–100 each)
Each dimension is intentionally boring—and that’s a compliment. Boring means measurable, repeatable, and hard to argue about. Each product gets a score per dimension, plus an overall score (average or weighted average if you want reliability to matter more).
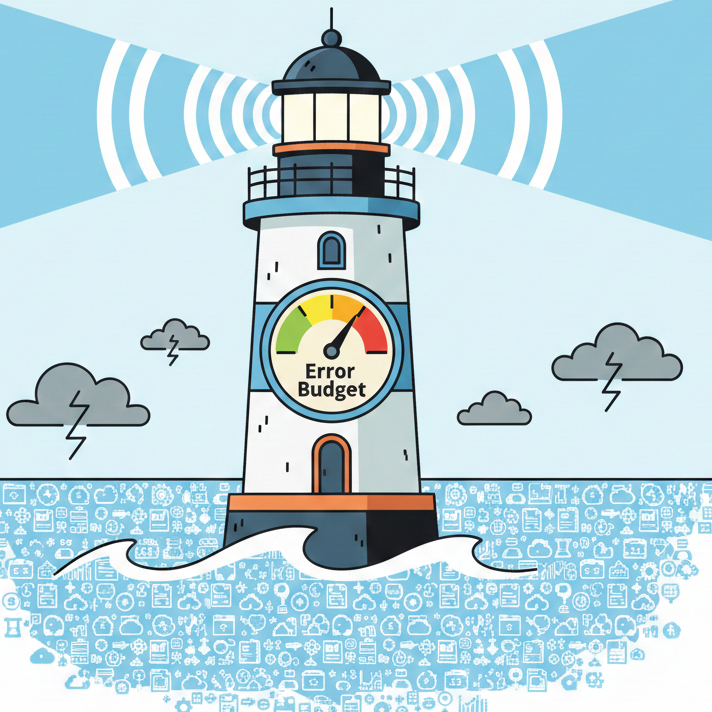
Reliability & Error Budget — “Does it show up when people need it?”
Ownership becomes real when stability is visible.
What to measure (automatic):
- SLO compliance (freshness / availability / completeness—whatever fits your product type)
- Error budget burn rate
- Severity-weighted incidents
Guardrail: only score reliability when there is enough real traffic (minimum reads/events). Otherwise “unused” looks “perfect.”
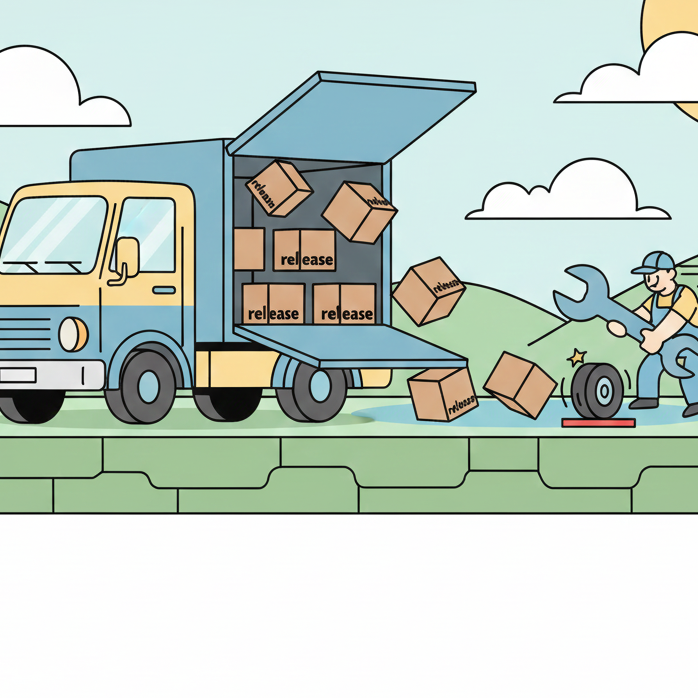
Change Quality — “Can you ship changes without chaos?”
Most pain doesn’t come from change. It comes from change that causes rollbacks, incidents, and weekend firefights.
What to measure:
- Change Failure Rate (deployments → incident/rollback within 72h)
- Median MTTR (severity-weighted)
Guardrail: only count incidents above a defined severity level.
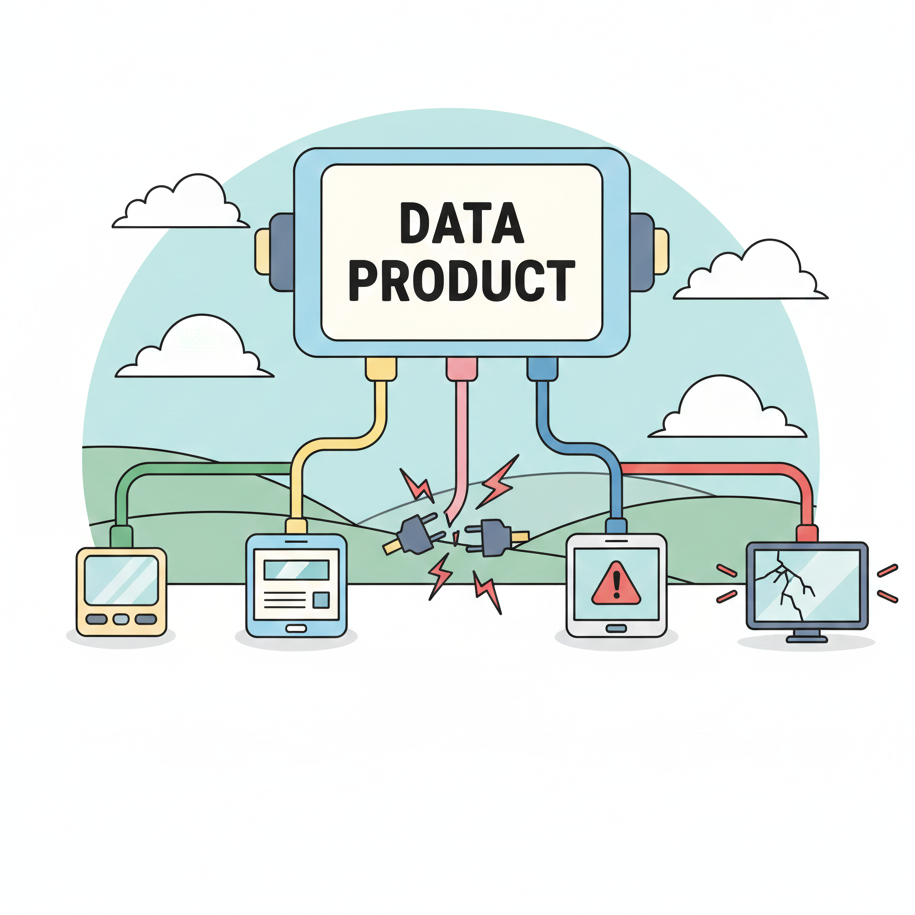
Contract & Evolution Stability — “Do downstream consumers stay safe?”
A breaking change is a trust tax. At scale, you don’t want to punish change—you want to punish consumer-impacting breaks.
What to measure:
- Consumer-impacting breaking changes per quarter
(count only breaks correlated with downstream failures/alerts)
Guardrail: “schema changed” is not a failure unless it actually breaks consumers.
Consumer Experience (without surveys) — “How much friction do consumers feel?”
If you can’t reliably measure business value everywhere, measure friction. Friction shows up in tickets, access delays, and rework.
What to measure:
- Defect ticket rate per 1,000 reads (or per 100 active consumers)
- Median time-to-access (request → granted)
- Ticket reopen rate
Guardrail: categorize tickets (defect vs how-to). Defects weigh more.
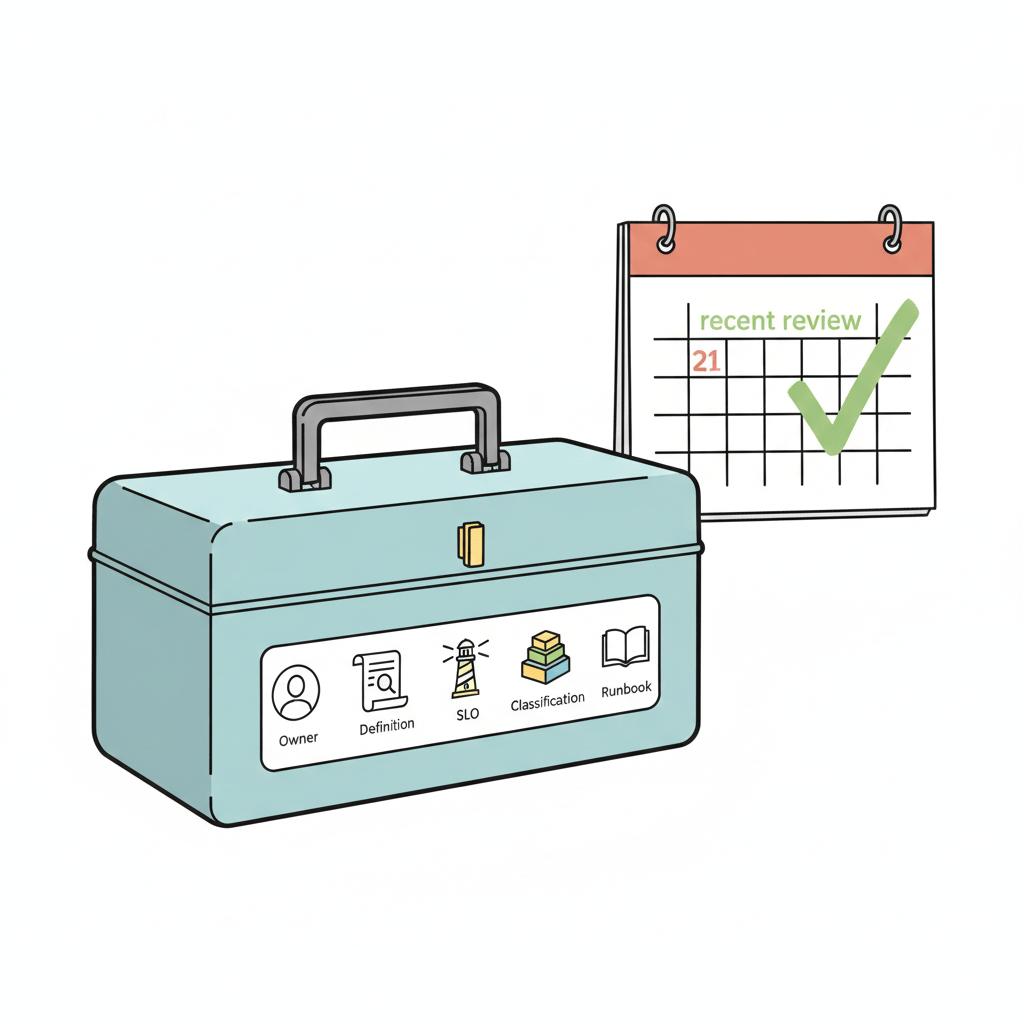
Product Hygiene — “Is it findable, owned, and operable?”
With 600 products, hygiene isn’t bureaucracy. It’s survival.
What to measure:
- Metadata completeness (owner, definition, SLO/SLA, classification, lifecycle)
- Review recency (“reviewed within 90 days”)
- Runbook / on-call readiness (alert route + runbook link)
Guardrail: “exists” doesn’t count unless it’s reviewed recently.
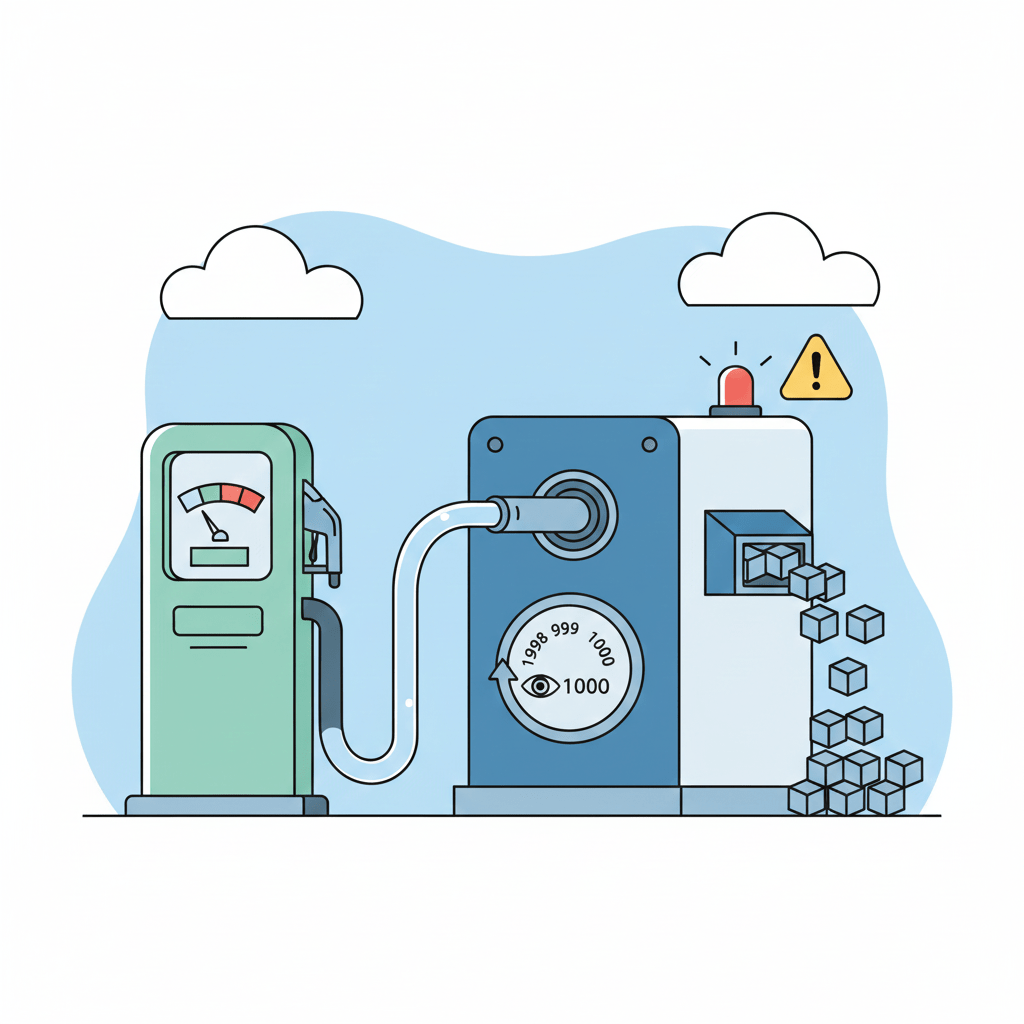
Cost Efficiency — “What does it cost per unit delivered?”
Cost is a universal lever—if you measure it the right way. Absolute cost is noisy. Cost per unit of consumption is actionable.
What to measure:
- Cost per 1,000 reads/queries (or cost per GB delivered / per event)
- Idle/overprovisioning indicators (high cost + low usage)
Guardrail: score as trend (QoQ) and usage-normalized.
Bronze / Silver / Gold: maturity beats rankings
Instead of ranking 600 products (and creating politics), treat this like a maturity model:
- Bronze: basics covered (clear owner, SLO defined, baseline monitoring)
- Silver: stable ops + low defect friction + disciplined evolution
- Gold: consistently reliable + consumer-friendly + cost-efficient + excellent hygiene
A practical rule that avoids perfectionism:
Gold can mean “Gold in 4/6 dimensions and at least Silver in the other 2.”

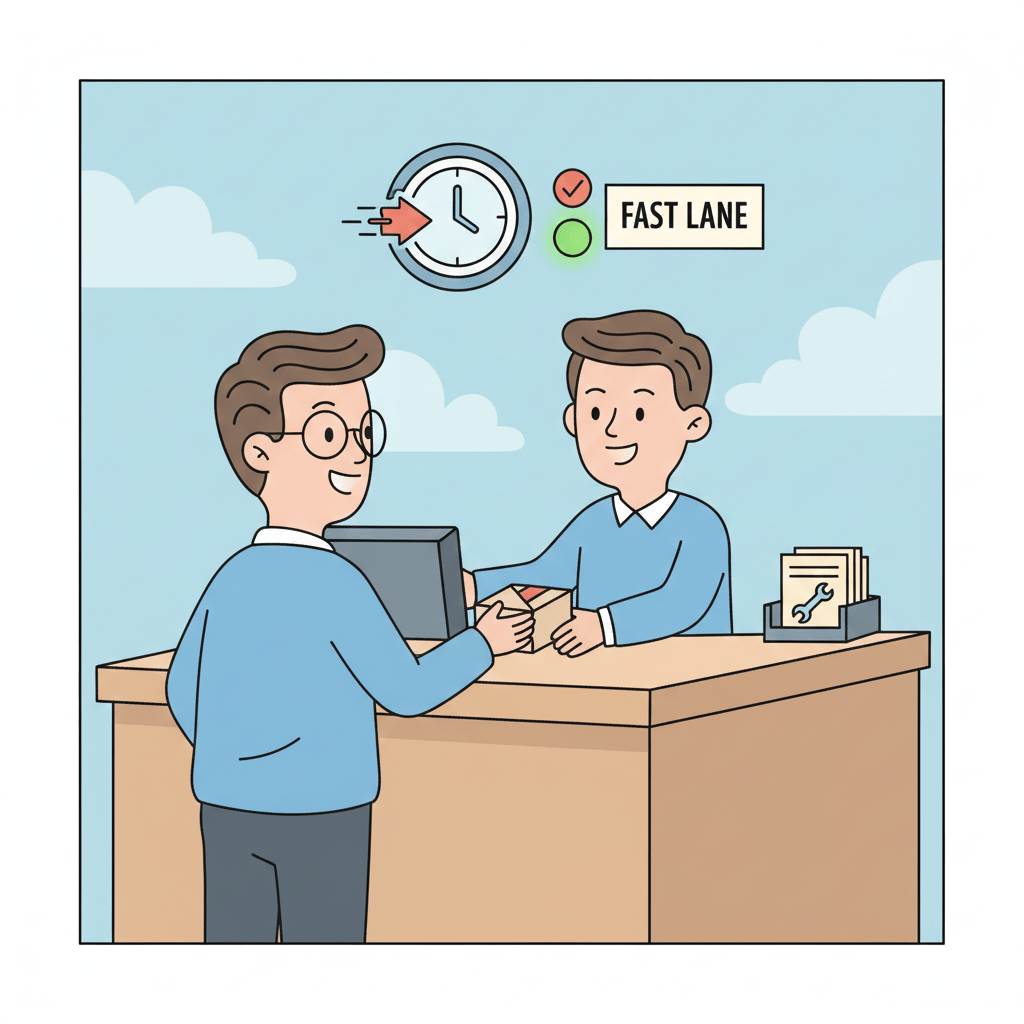
The best incentives aren’t always money (and they scale better)
If you connect this scorecard directly to compensation, you’ll spend months arguing edge cases. At scale, the strongest incentives are operational and cultural:
- Priority credits: Gold products get faster access to platform engineering support.
- Capacity flexibility: cost-efficient teams get easier approval for scaling.
- Visibility: a quarterly “Gold Gallery” that is factual and short (no marketing theatre).
- Toil reduction: better maturity earns more automation support—reward = less pain.
The simple formulas (so nobody argues about math)
defect_rate = defects / (reads/1000)ticket_rate = tickets / active_consumerscost_efficiency = cost_chf / (reads/1000)CFR = deployments_with_sev_incident_72h / total_deploymentsbreak_rate = consumer_impact_breaks / quarter
what this changes in practice
A good scorecard doesn’t create pressure—it creates clarity.
It tells every Data Product Owner, in a language the platform can measure, what “good” looks like:
stable operations, safe evolution, low friction for consumers, clean hygiene, and costs that make sense.
And if you get the incentives right, something subtle happens:
Ownership stops feeling like a burden—and starts feeling like a craft.
Because in the end, a data product isn’t successful because it exists.
It’s successful because it’s trusted, used, and sustainably operated.

Leave a comment